
Downtime reasons
Select a scale and date range, review open or closed interruptions and classify their general or equipment-related cause.
Connect industrial weighing operations with local production control and synchronized web reporting through ScaleLink's integrated software ecosystem.
System architecture
ScaleLink connects industrial weighing equipment, local operational software, and synchronized web dashboards into a unified operational continuum.
Captures physical material weight and belt speed directly from conveyor belt scales, controllers and industrial sensors.
Windows application installed on plant operator workstations. Captures readings directly from weighing instrumentation and provides local production monitoring, shift totals and operational oversight.
Centralized web platform accessible from standard browsers. Displays operational summaries, production totals, reports and charts synchronized from ScaleLink Desktop across multi-plant operations.
ScaleLink Web displays synchronized information from ScaleLink Desktop and does not communicate directly with physical plant scales.
Local operations
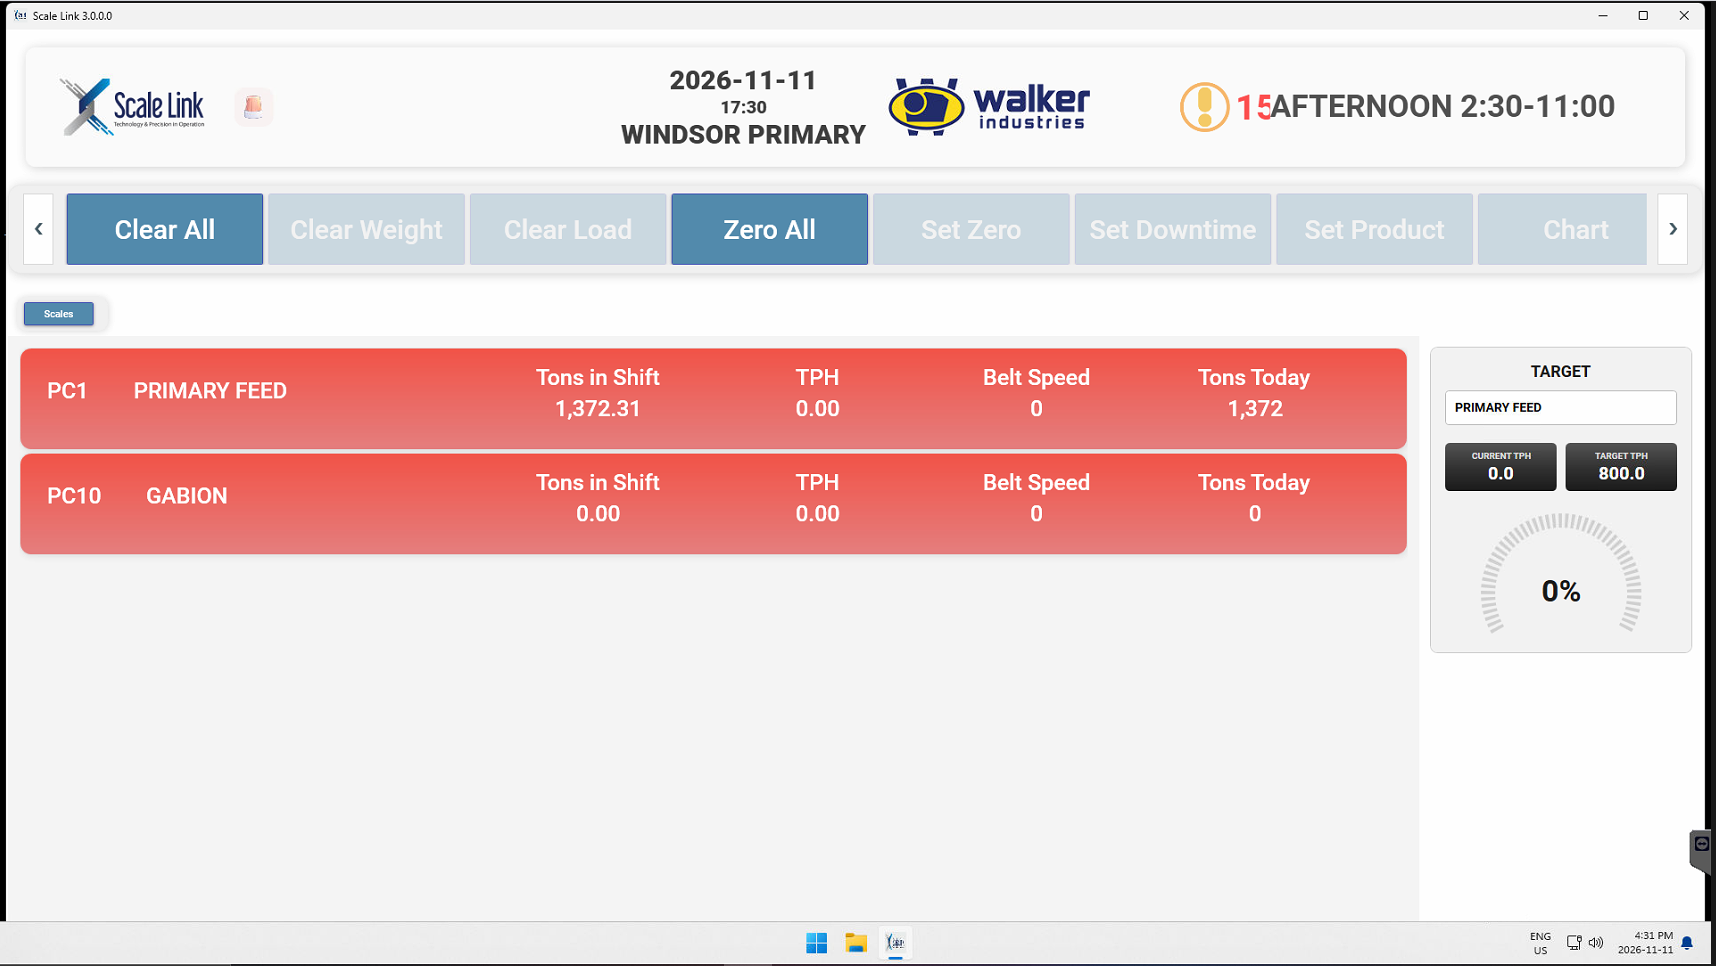
ScaleLink Desktop brings weighing information and operational tools together in a Windows interface built for industrial environments and continuous uptime.
Actual product screenshot
The main screen brings together PC1 and PC10, the product, shift tonnage, TPH and belt speed. The right panel compares current throughput with the selected product target.
Select a scale and date range, review open or closed interruptions and classify their general or equipment-related cause.
Select a scale and the product to record. This window brings together product selection and its assignment action.
Live weight, tons per hour, belt speed, load percentage and belt angle from every connected scale.
Daily, weekly, monthly and yearly totals with production targets per scale and product.
Downtime reasons per scale and equipment, plus temperature and current alarm states with acknowledgement.
Temperature, current, level and humidity channels with trend charts and historical records.
Local production records synchronize with ScaleLink Web when connectivity is available.
ScaleLink Web brings synchronized operational information into a centralized browser-based experience for management and multi-plant oversight.
Synchronized from ScaleLink Desktop: plant-floor resilience and local control without exposing field instrumentation directly to the internet.
Select a plant and review live scale readings and production summaries.
Live TPH, totals, speed, downtime, sensors, targets and status timelines.
APR, OEE, daily tons, weekly, performance, downtime and production reports.
Export report and chart data to CSV and print formatted report views.
Email alerts for scale connection loss and shift schedule deviations.
INSIDE SCALELINK WEB
From a scale reading to a full day's analysis. Explore real screenshots and discover what each view tells you.
The dashboard brings together the active shift, scale readings and production progress for the selected plant.
An overview that helps you decide where to look next.
Open image in a new tab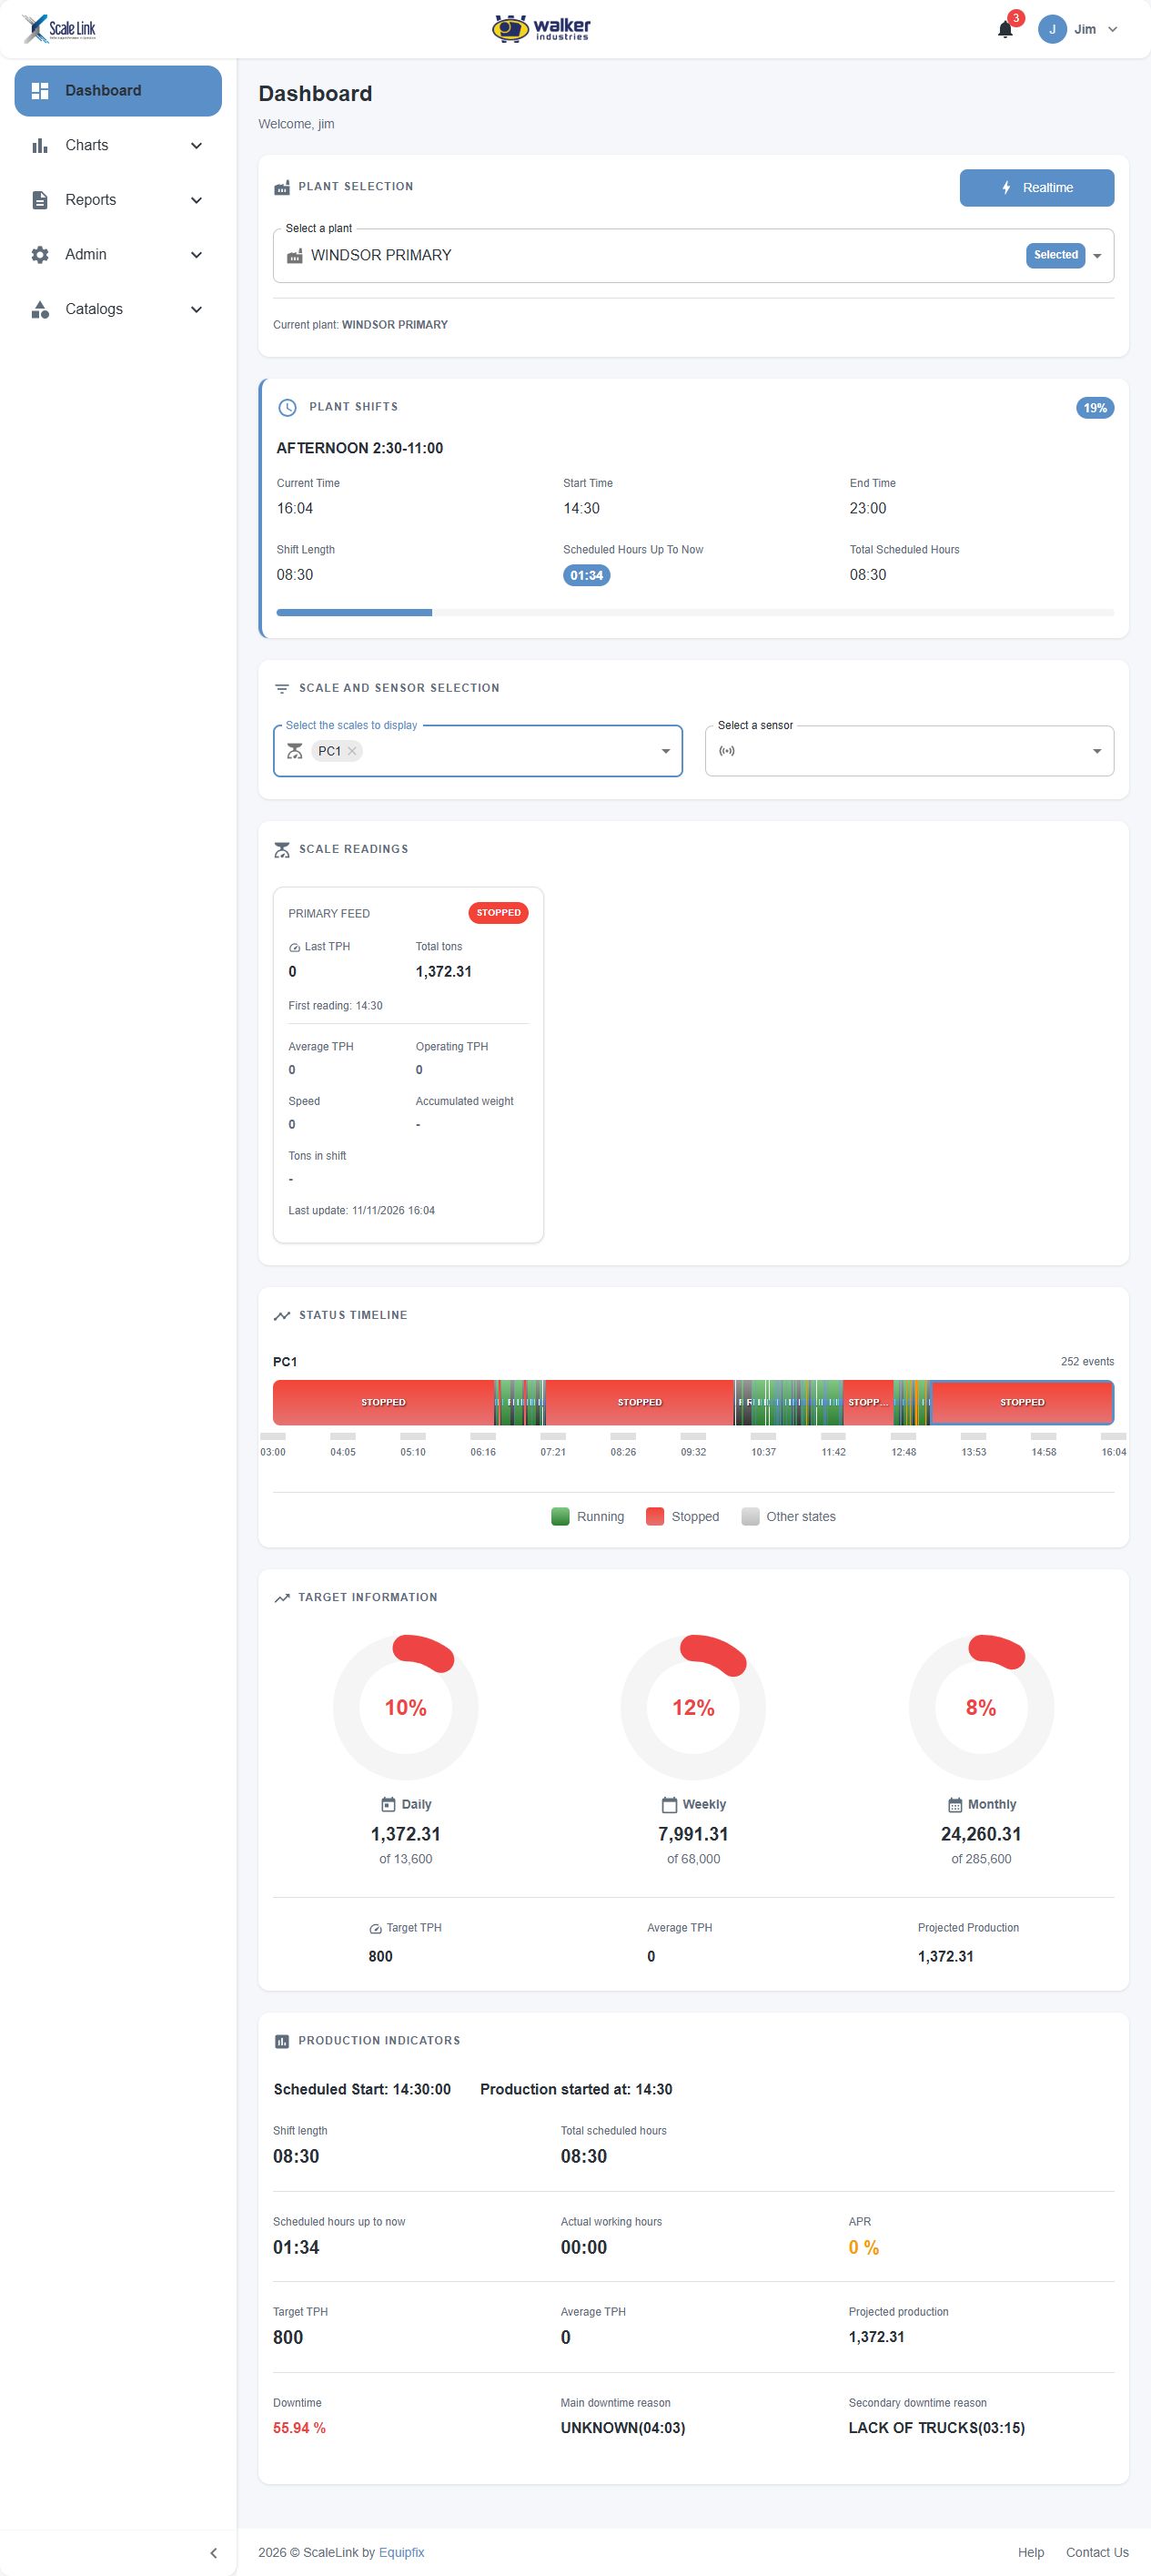
Scroll inside the screenshot to see all the details.
Live Chart plots tons per hour over a selectable time window, alongside a summary for each scale.
See when and how material flow changes.
Open image in a new tab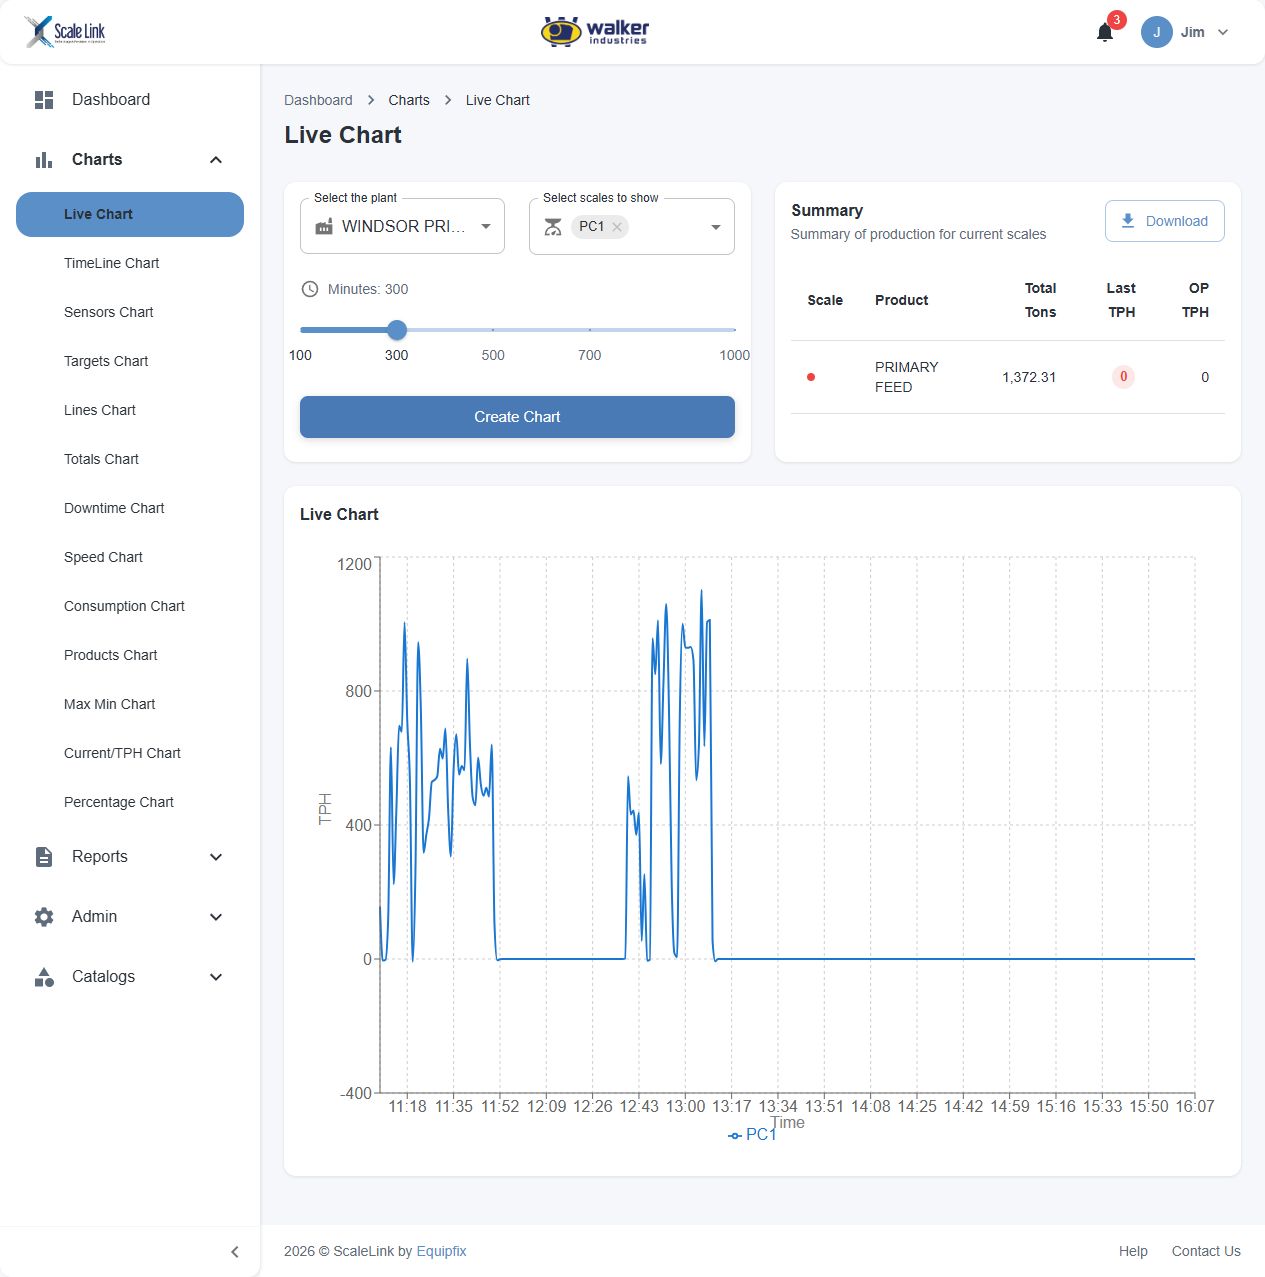
Scroll inside the screenshot to see all the details.
The totals chart combines daily production bars with the target line. A table below retains the tonnage detail by date.
The same information as a visual trend and a detailed table.
Open image in a new tab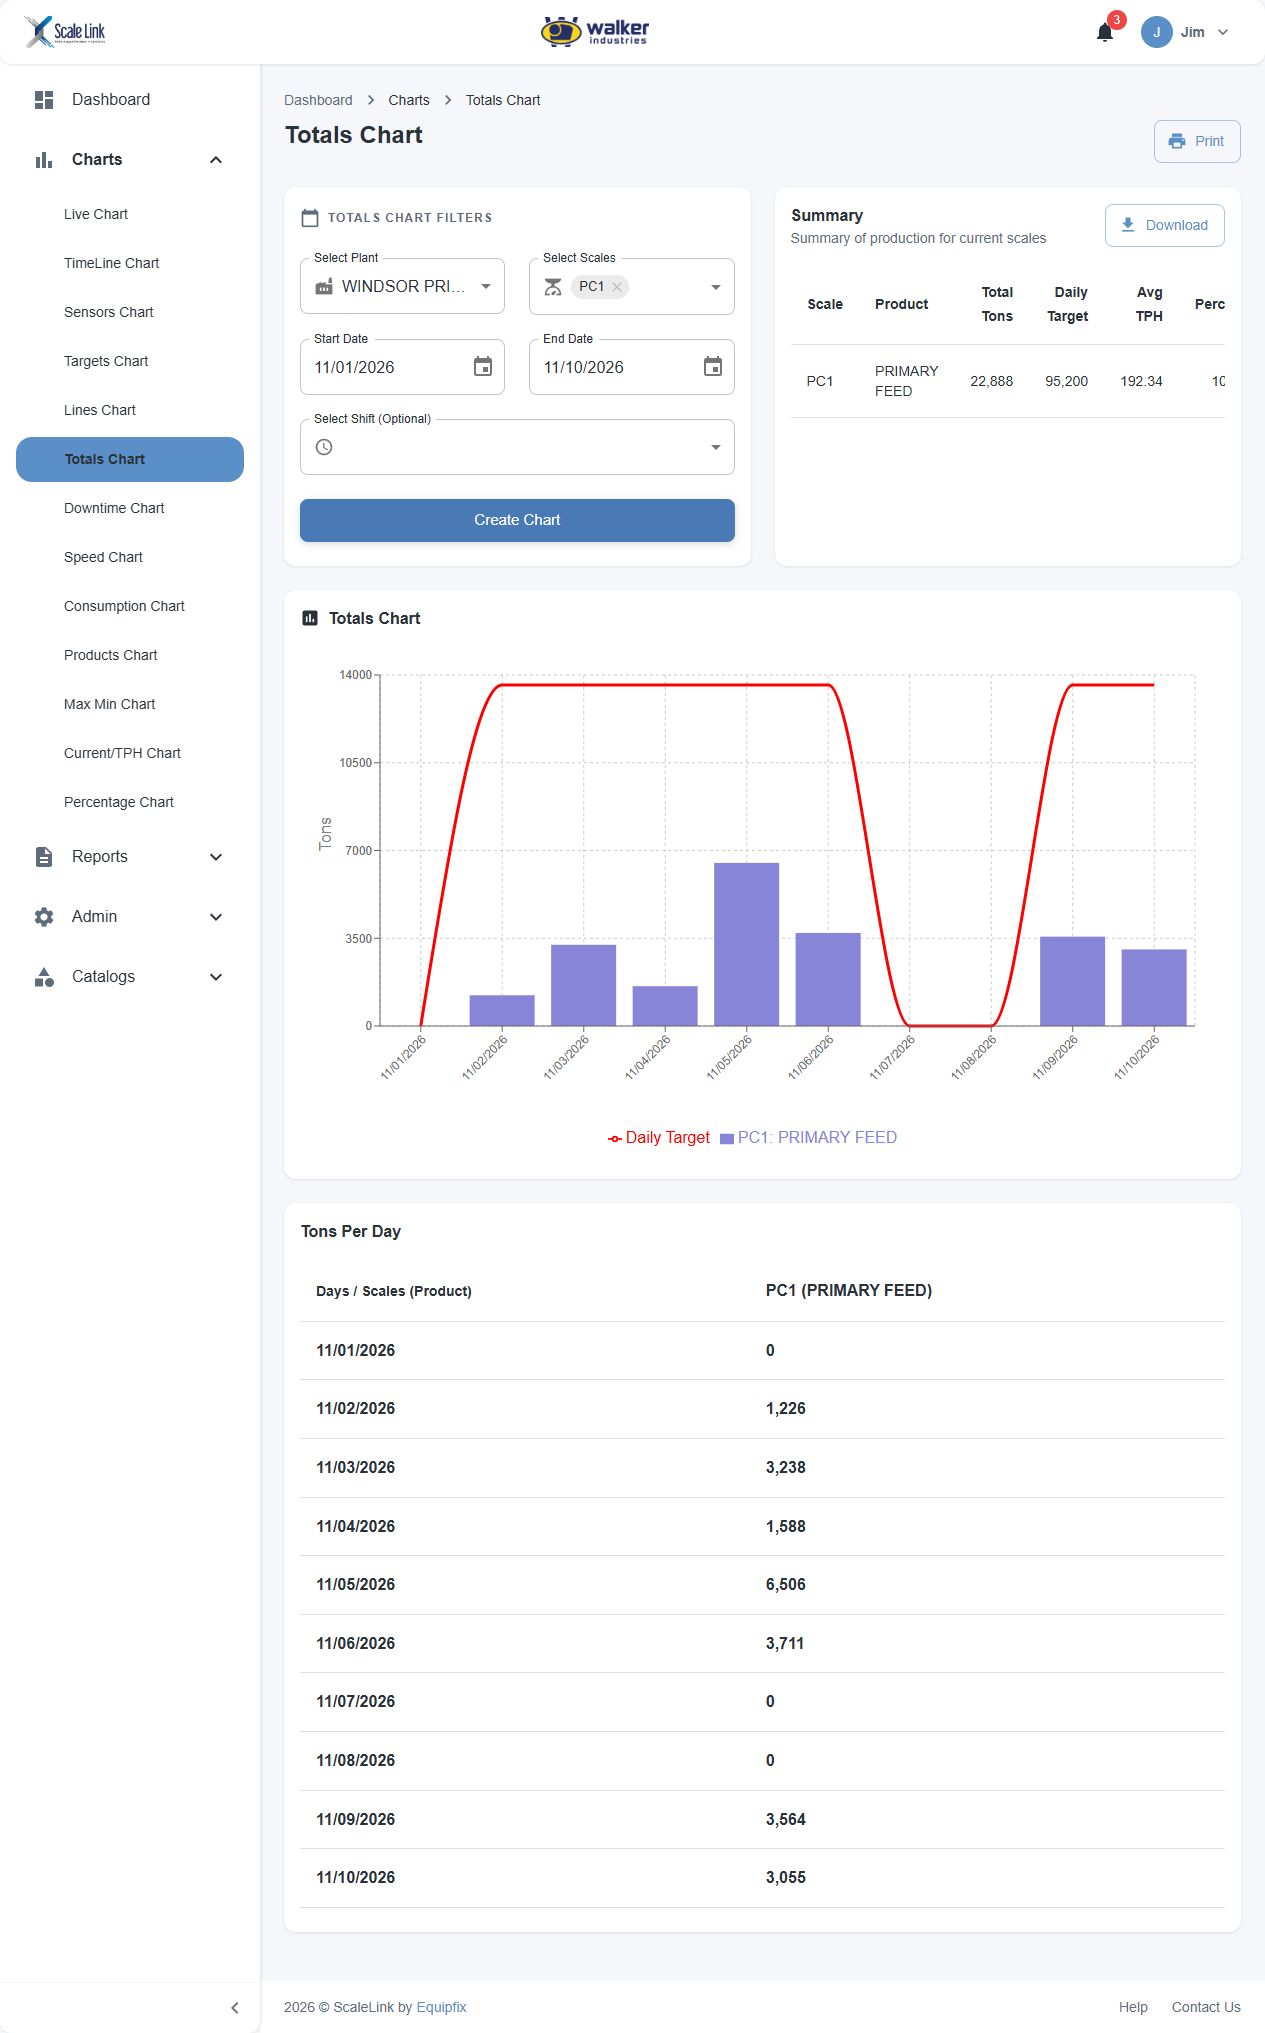
Scroll inside the screenshot to see all the details.
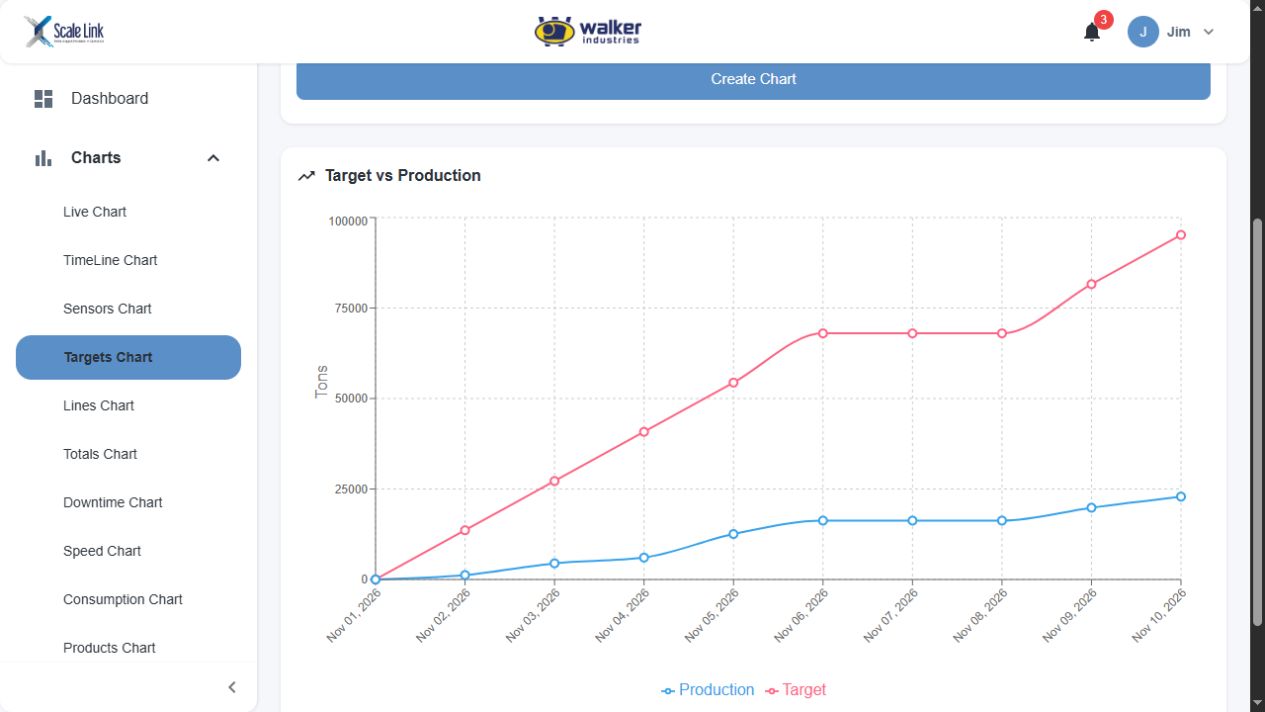
The targets view compares a product's accumulated production with its accumulated target over the selected period.
A direct view of progress and the remaining production gap.
Open image in a new tab Scroll inside the screenshot to see all the details.
The timeline lays out scale states over the shift. The summary above shows the hours spent in each state.
Time context adds another dimension to production totals.
Open image in a new tab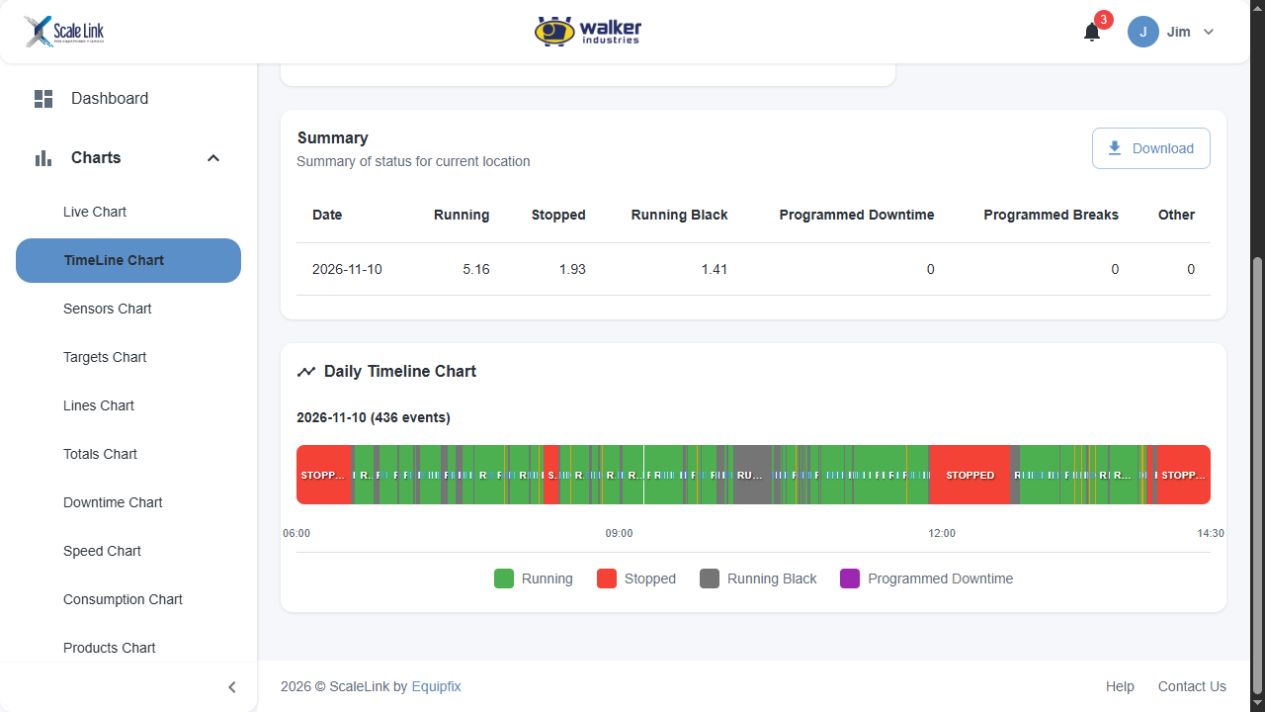
Scroll inside the screenshot to see all the details.
Daily Production lists the product, first and last readings, daily target and recorded tonnage for each day.
A tabular record for reviewing and sharing production.
Open image in a new tab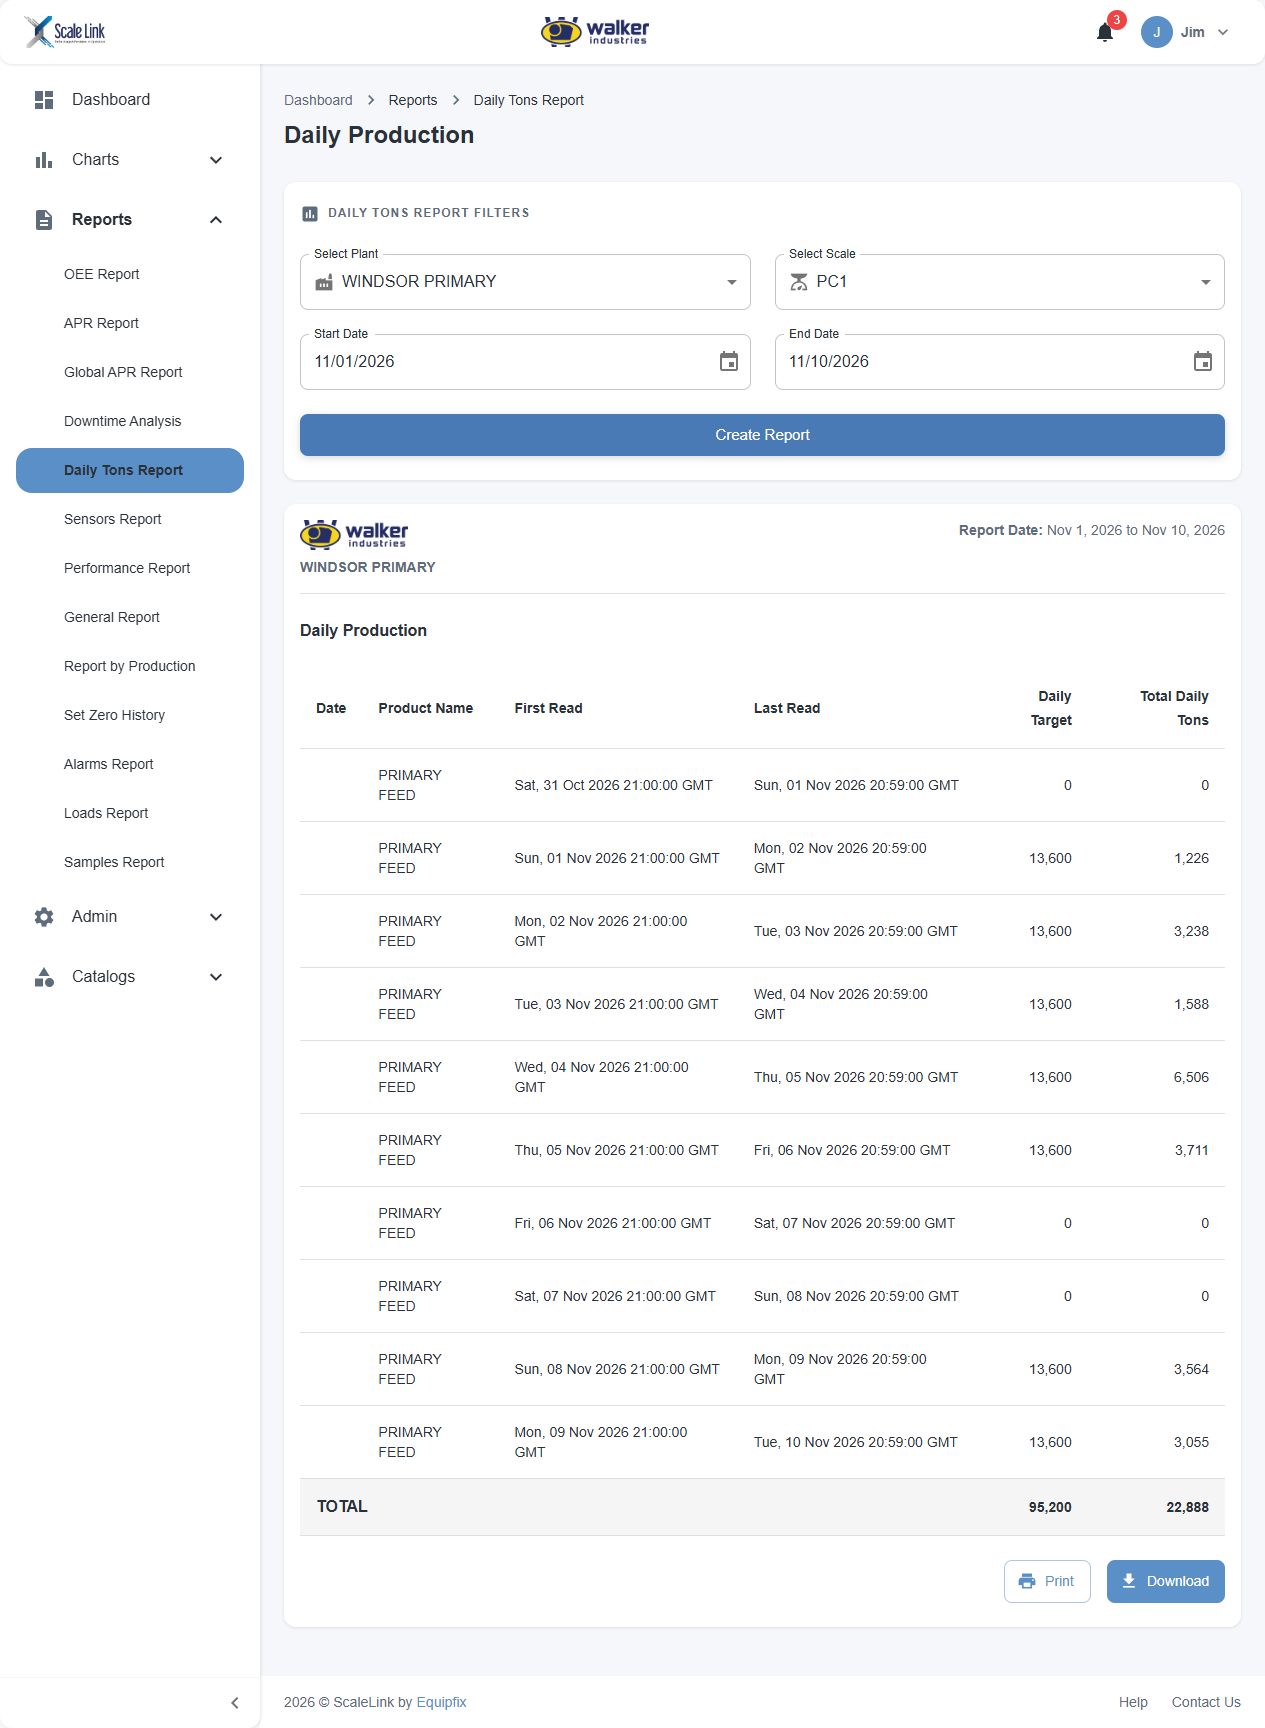
Scroll inside the screenshot to see all the details.
The APR report relates recorded working hours to scheduled shift hours, showing daily APR and its running value.
Assess how scheduled operating time is being used.
Open image in a new tab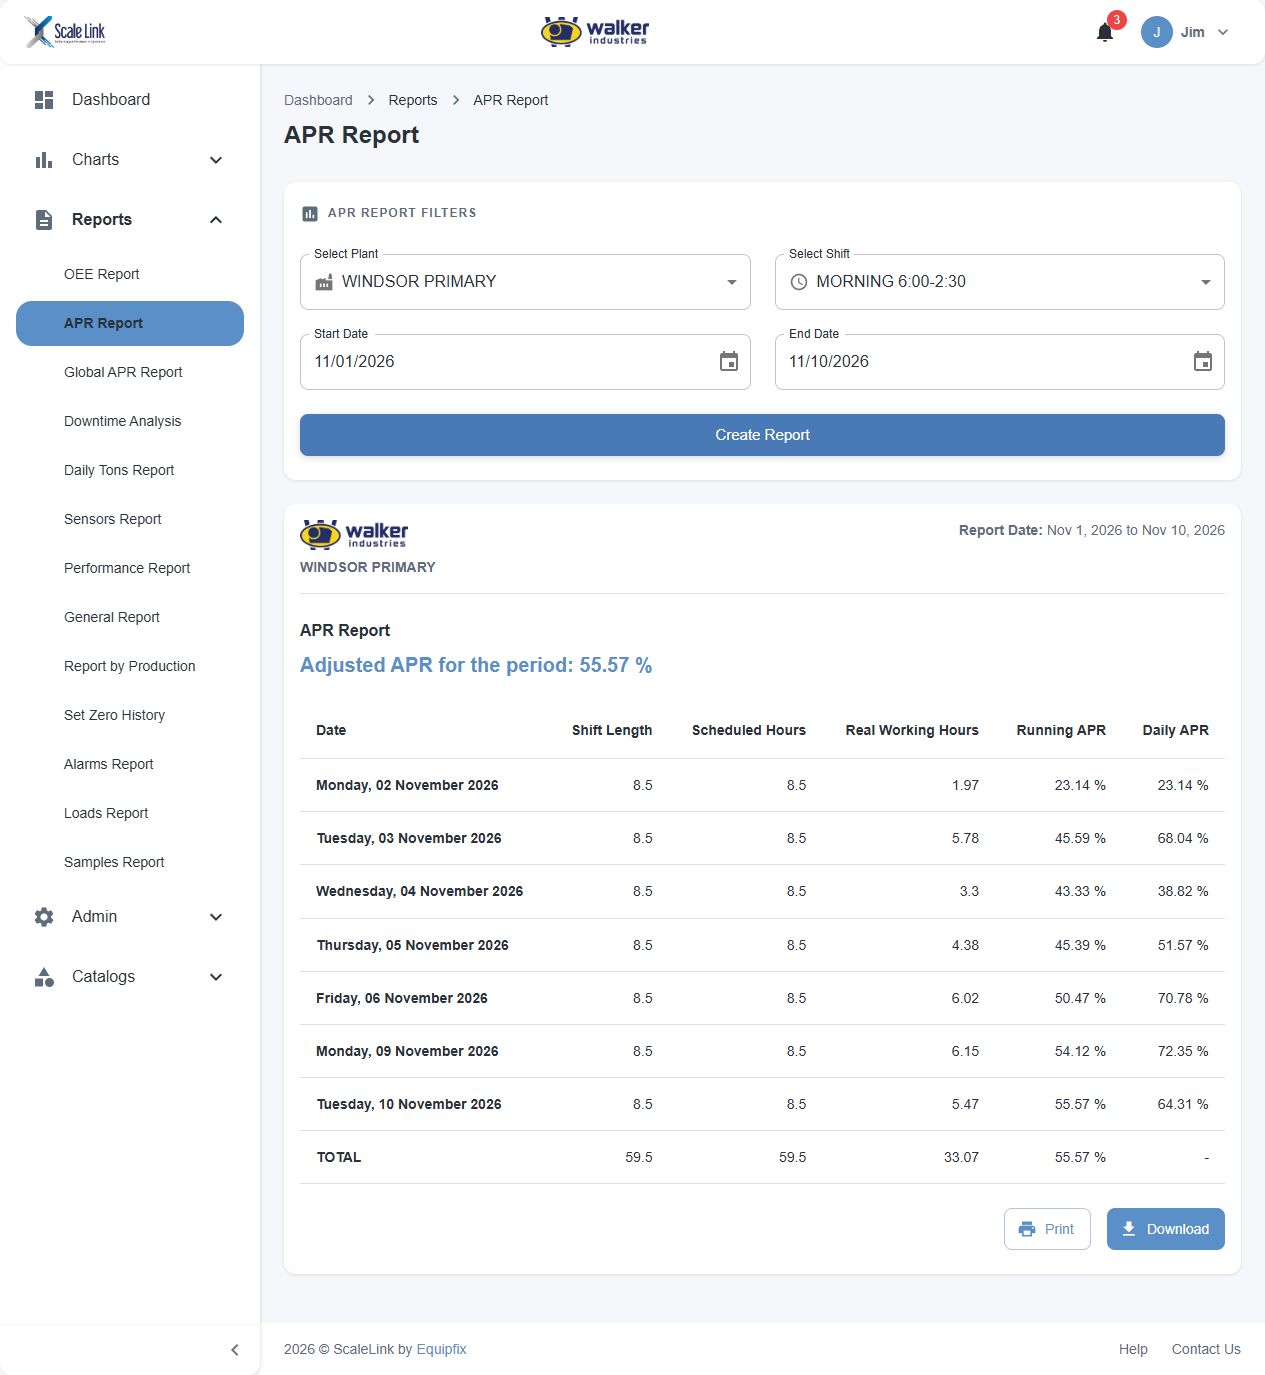
Scroll inside the screenshot to see all the details.
Downtime Analysis groups interruptions by reason and equipment, with hours, downtime percentages and estimated lost tonnage.
A starting point for prioritizing operational loss analysis.
Open image in a new tab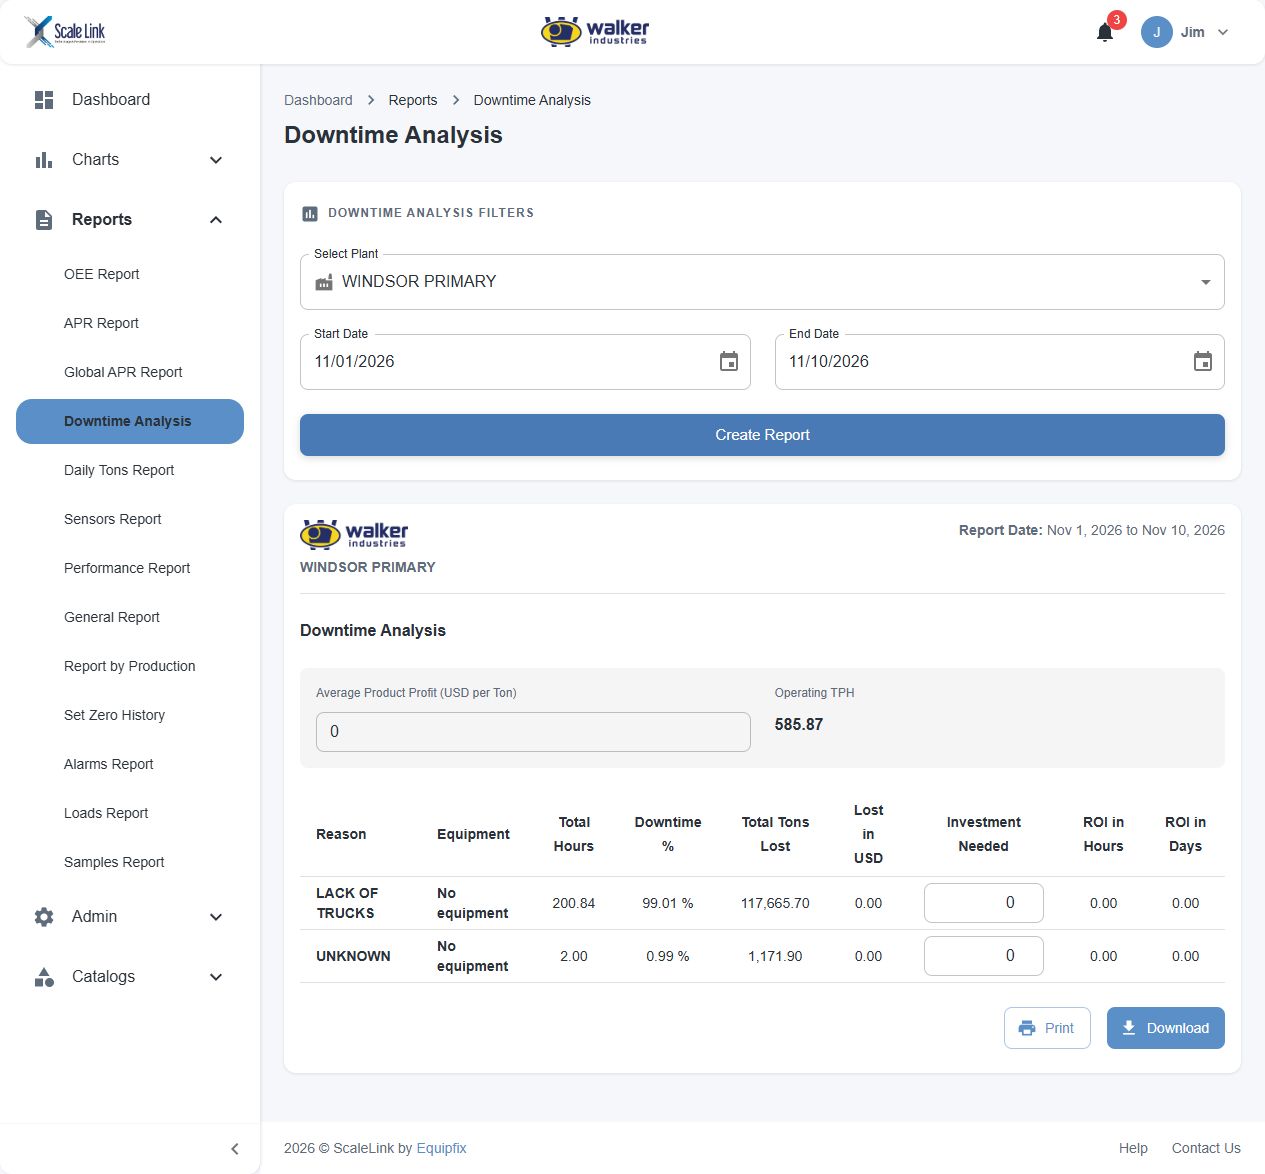
Scroll inside the screenshot to see all the details.
The general report combines production, targets, operating and average TPH, hours and APR for a selected scale and period.
A review view for teams that need numerical detail.
Open image in a new tab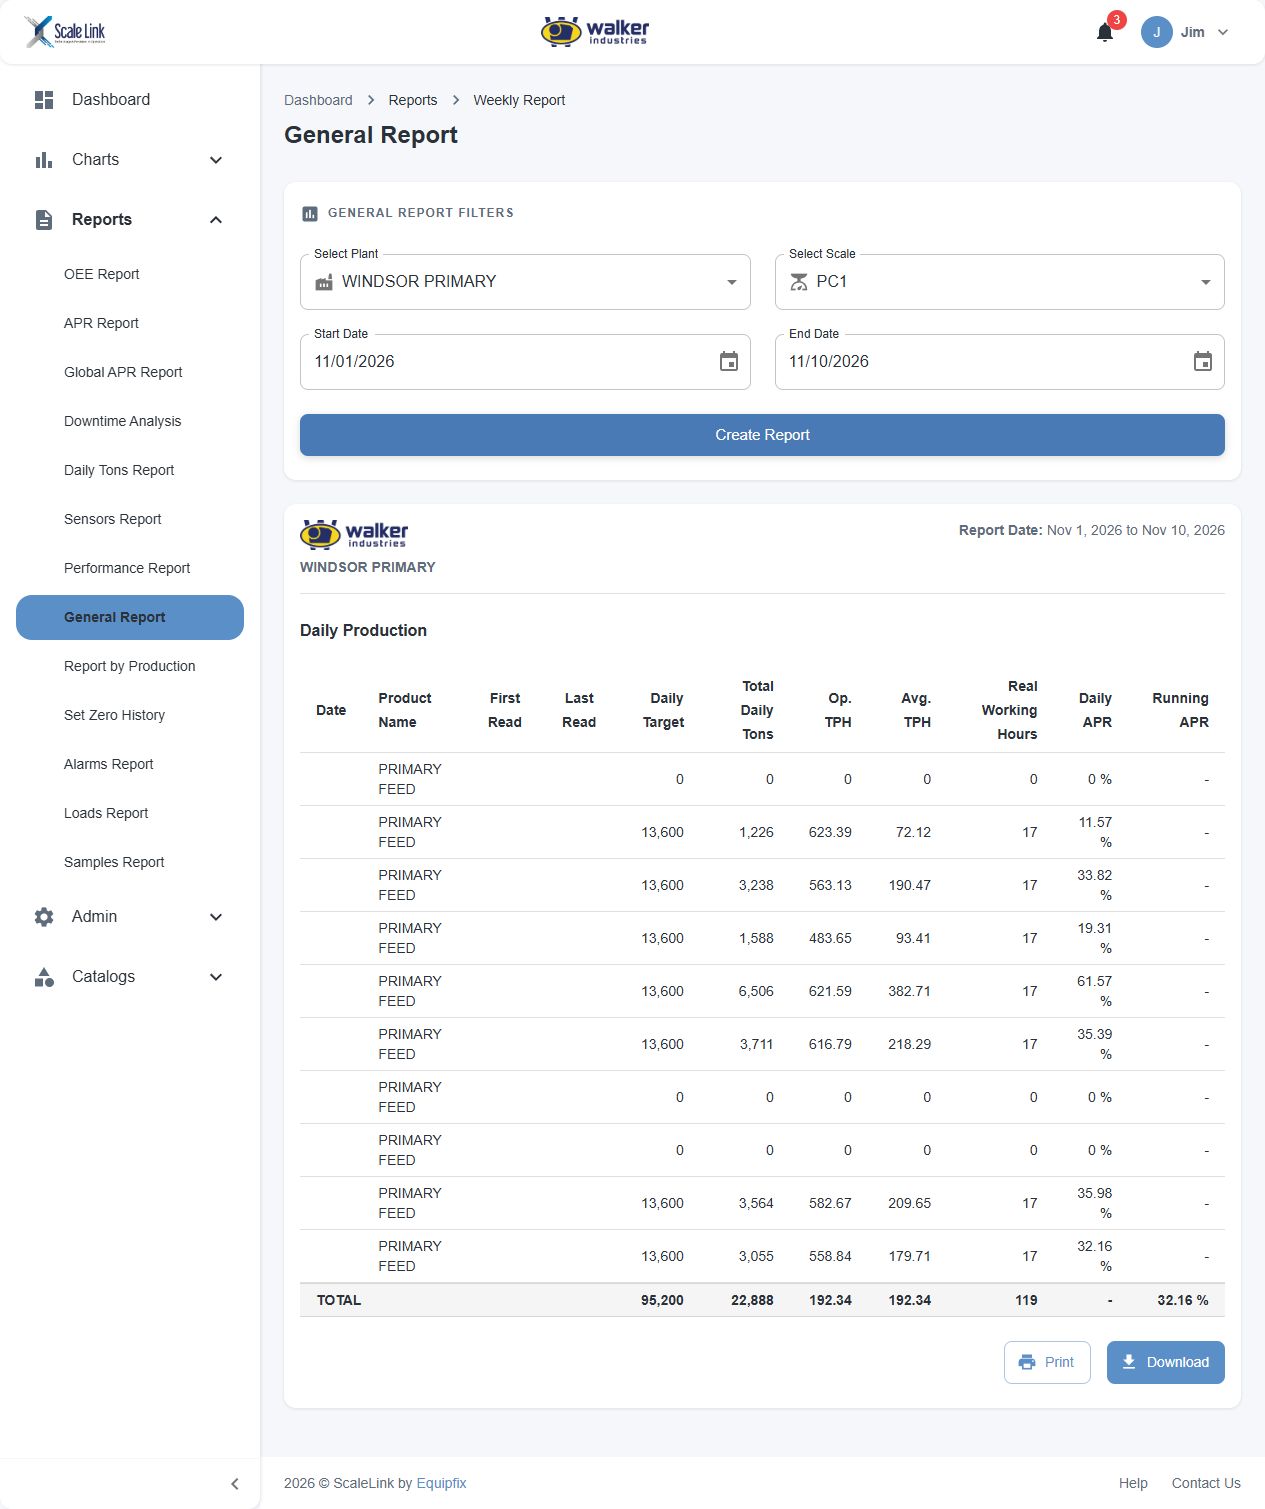
Scroll inside the screenshot to see all the details.
The portal's Speed Chart displays a TPH series throughout the day, alongside a production summary and the LOSS series.
Explore throughput variation within a production day.
Open image in a new tab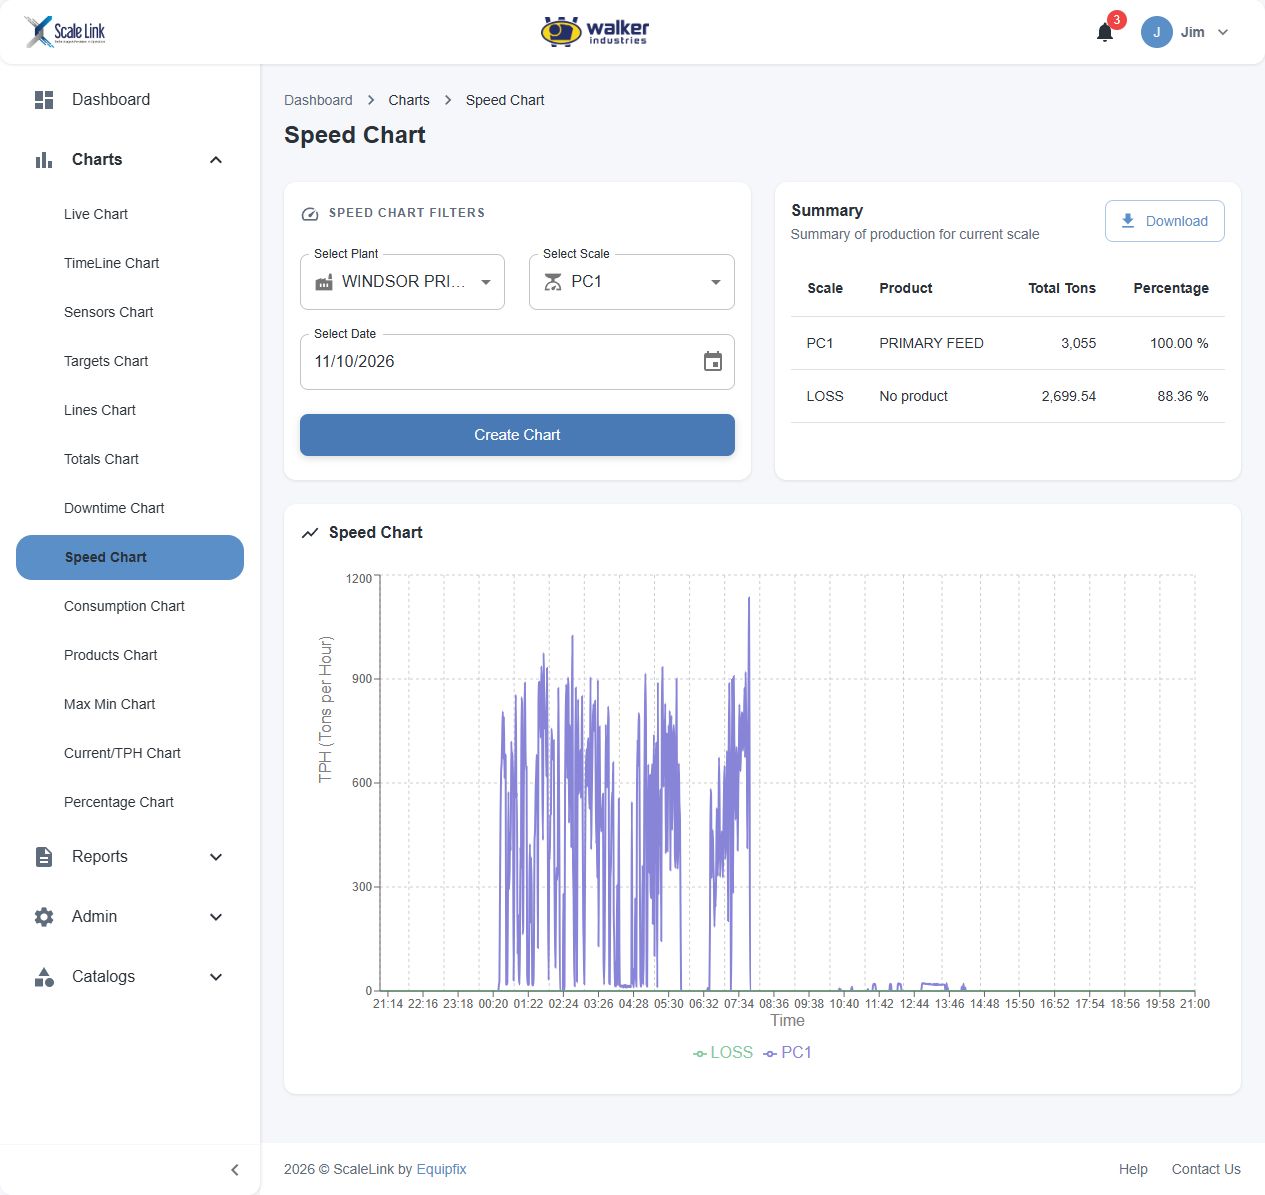
Scroll inside the screenshot to see all the details.
These are static portal screenshots taken on November 11, 2026. Period reports cover November 1–10; the timeline and daily throughput cover November 10. Values belong to those queries and do not update on this page.
Connected workflow
A four-step data architecture designed for uninterrupted industrial continuity and centralized oversight.
Belt scales and industrial sensors capture continuous material weight, belt speed and equipment condition.
Step 01 · Physical Instrumentation
ScaleLink Desktop provides the operator interface for monitoring, shift totals, targets and local control.
Step 02 · Operator Workstation
Production records and shift summaries are synchronized to ScaleLink Web when connectivity is available.
Step 03 · Web Synchronization
Management reviews dashboards, charts and reports across plants and periods.
Step 04 · Centralized Overview
Deployment sectors
Designed for continuous reliability across aggregate mining, industrial bulk plants, and high-throughput marine loading terminals.
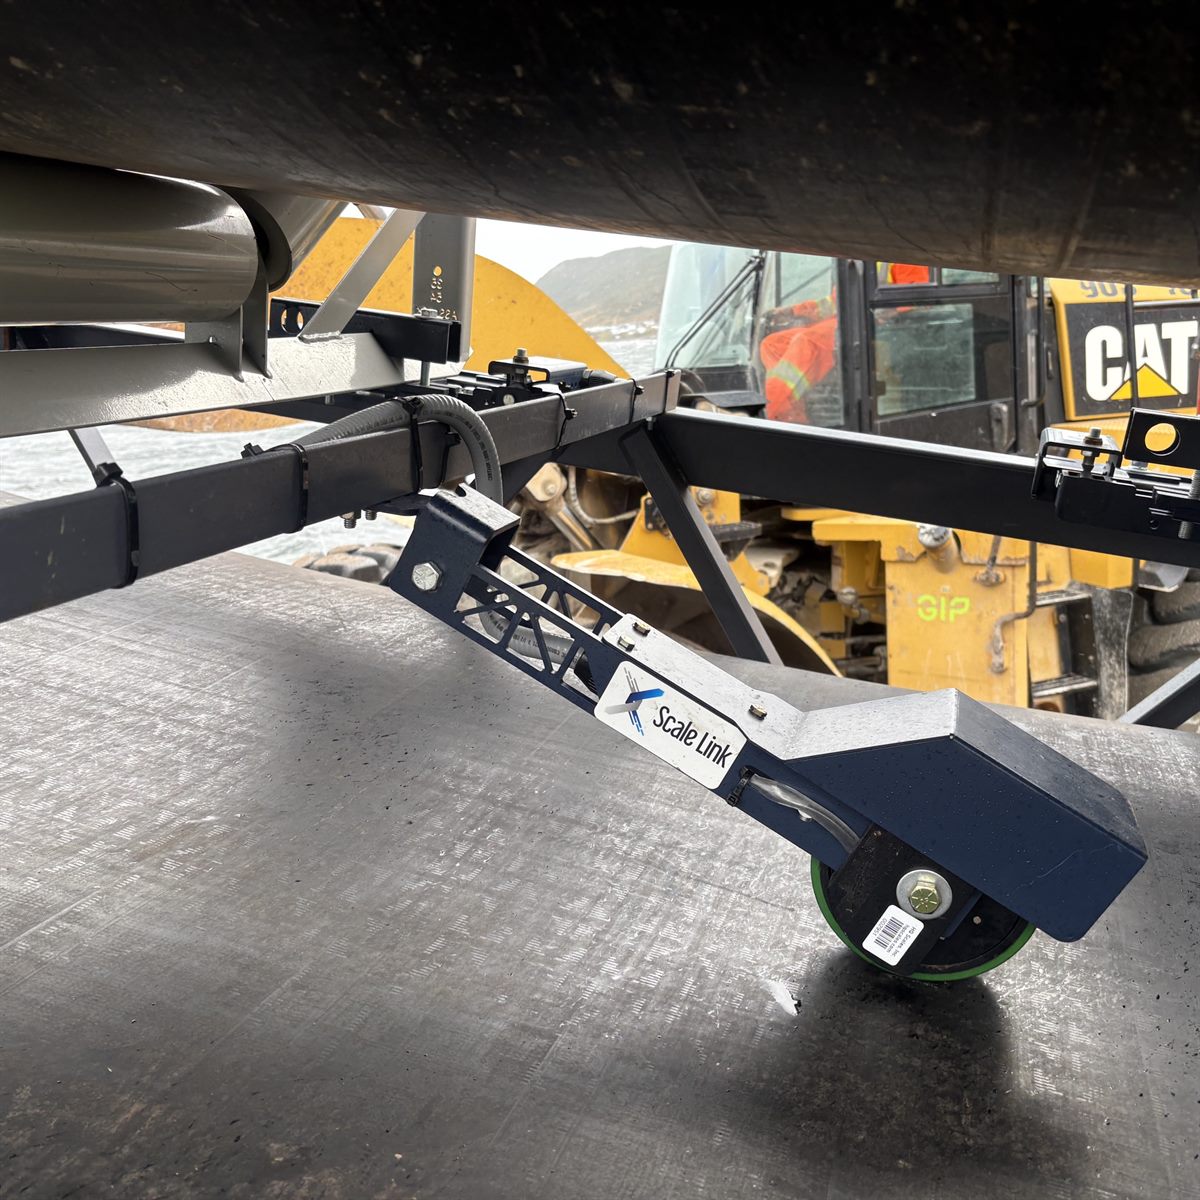
Continuous belt scales in quarrying and mining operations track real-time tons-per-hour throughput and totalized shift output to maintain balanced material flow.
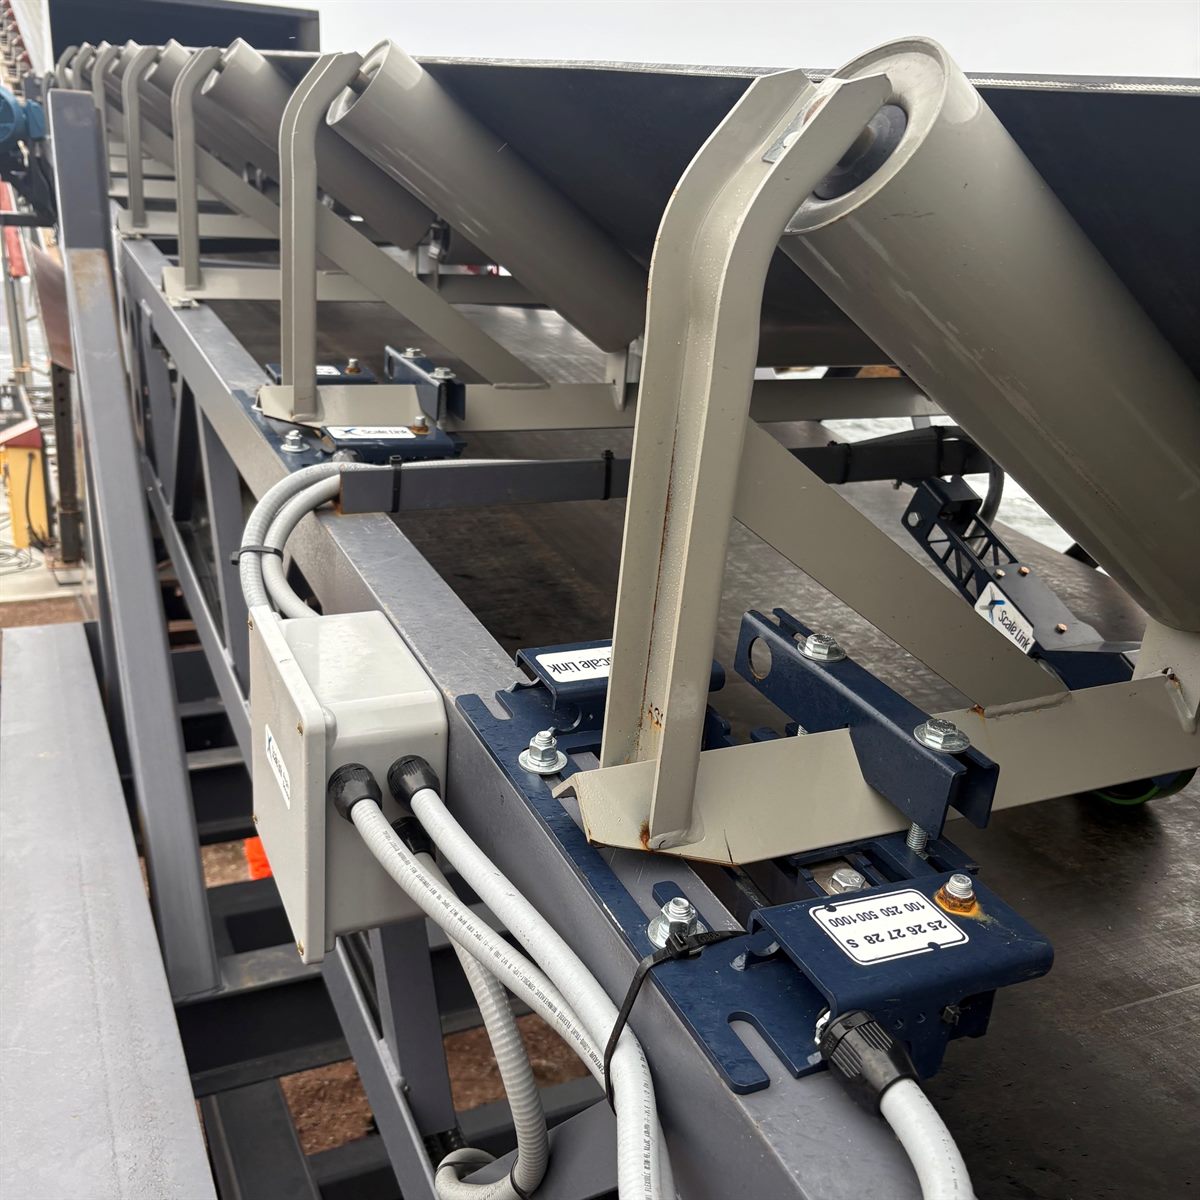
Aggregate plants and bulk processing facilities consolidate multi-line shift totals, operating hours, and material throughput across screening circuits.
Discover how ScaleLink Desktop and ScaleLink Web can support your industrial weighing and production reporting needs.
Speak directly with our technical team about workstation deployment, scale integration, and synchronized reporting.